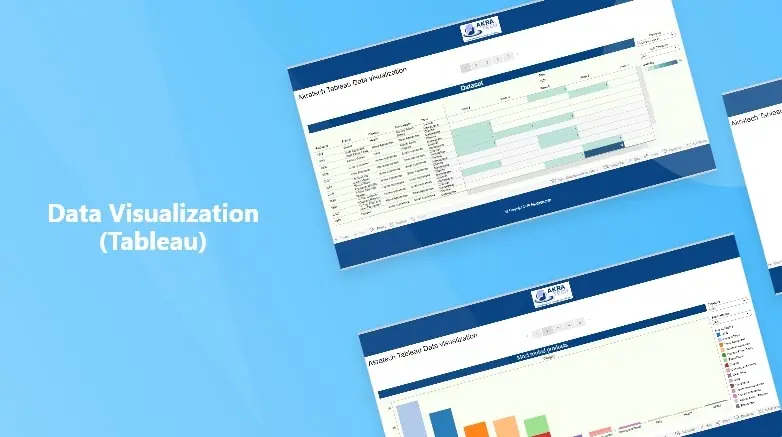
We have created various visualizations using dashboard views for any kind of data representation, through the use of tableau for analytical reporting.
We have created a visualisation for E-commerce stores, offline stores and many more. Finally, we deliver clean data in the client’s preferred format.